
—–.-….. -.-.—-… ….. .- -…..- -.-…-.-.-.–.– —- .-…–..
I’ve been following Zevan Rosser’s blog for a little while now and I dare say it’s really a great piece of blog.
lately he did a couple of things with the twitter API and I told myself why not?
Usually I fear APIs as I’m not at ease with complex things but this twitter stuff seemed really easy to cope with.
and indeed I quickly found myself playing with this social network’s very substance: the tweets :)
But once I could get what I wanted from twitter, a huge piece of nihil fell on my face like : “WHAT DO I DO WITH ALL THAT?”
which is a true question btw and (imho) the very stake of data visualization.
I was lost.
so I did what I usually do in such cases: fuck around and see what comes out.
I vaguely wanted to embody each tweet as part of a cluster like this bacteria generator I did some time ago.
so first I used an attract / repell script (found here a long time ago and ported to AS3) which gave me these psychedelic pictures:
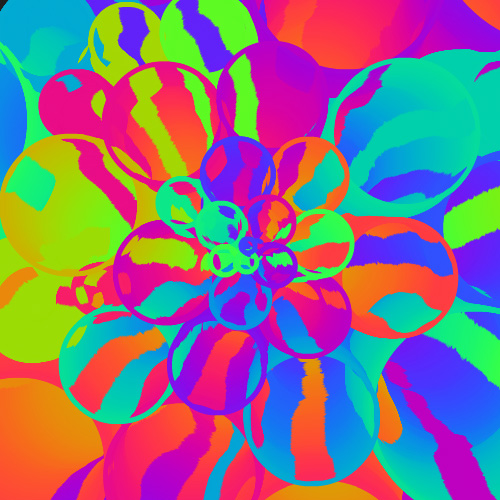

then I thought “as we have an avatar in Twitter, why not using it instead?”
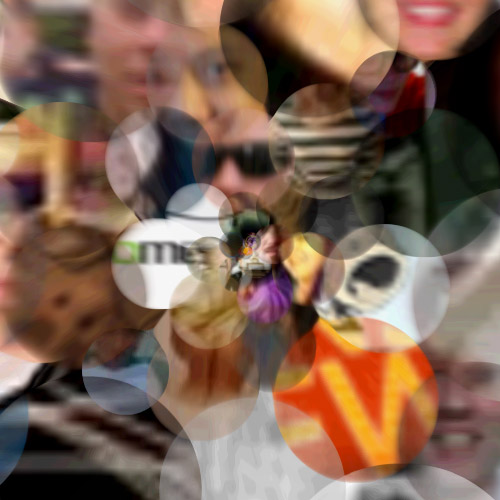
wasn’t really convinced so I tweaked the blendmode and obtained this:


looks like the next NIN album cover ^^
after which I used a basic gradient to make my cluster and it looks nice too:
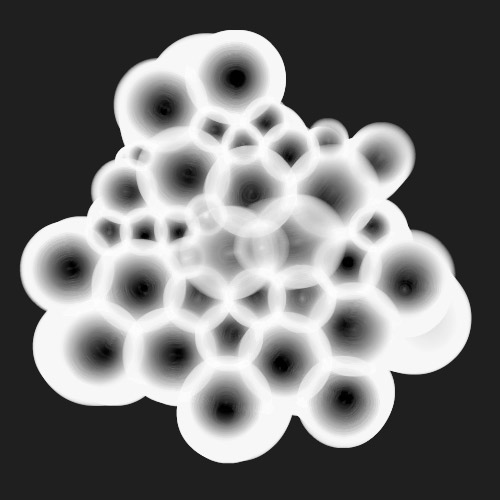
after which I started working on the tweets’ content.(yeap ; not the people…later)
until now i was using tweets talking about: ‘sex’ or ‘mona lisa’ or ‘insect’.
a bit limited even if the results were varied enough.
in the case of ‘sex’ (as for ‘drugs’ & ‘rock’n rol’ I guess ), you can collect up 10 new messages / second, for ‘mona lisa’ it’s rather 1 msg/20-30 minutes and for ‘insect’ it’s more like 1 msg/hour.
different rythms , different colors ( colors are indexed on the unique ID of the message young => blue, old => red).
So I started looking for more meaningful terms of search.
I found a list of verbs that were used the most in tweets : http://www.chrisfinke.com/2007/07/10/twitter-what-are-people-doing/
it goes like:
go watch listen get play work try read wait look do have be think wonder eat head feel make meet sit take use drink write talk come start check run shop enjoy leave test clean sleep wish browse drive buy update hope walk move blog catch pack twitter see hang put love plan edit set prepare finish wake give add bookmark live download post call learn install train find rain send say laugh alternate cook relax wear kill consider show want fly surf contemplate chat sing code help study dance fight fix ride realize record stand stay turn spend
first thing I did was to perform a set of keyword searches( using the verbs’ list ) then counting how many times each verb was used in the other tweets and finally link them like:
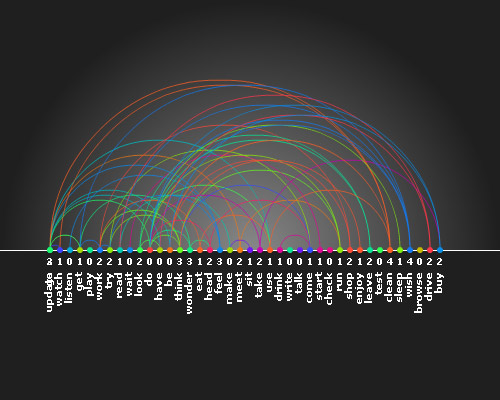
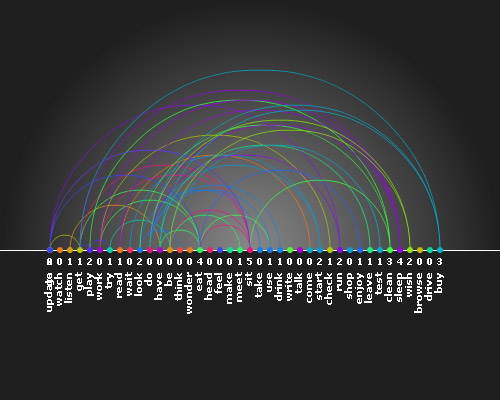
“Look mommy I’m doing exactly like the dudes at visual complexity!” ;) this site is huge btw!
you can check an interactive version of it here
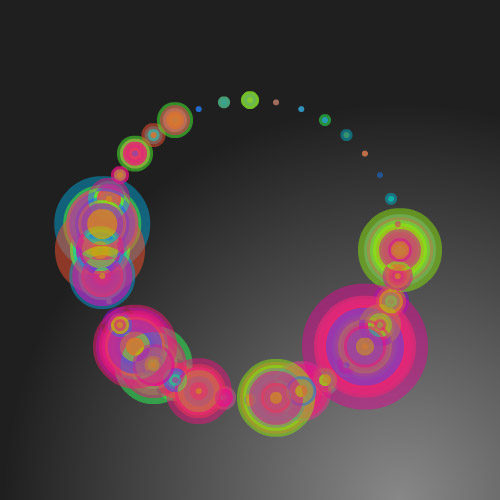
Then I did something that counts the occurences of each letter in the tweet and represents them as dots.
the dot size therefore depends on the number of times it appeared in the tweet.
I took this series:
‘abcdefghijklmnopqrstuvwxyz0123456789′
the letters are sorted clockwise ( A is the rightmost ).
click to get the next verb.
then I tried another way to represent this and used my brand new natural cubic spline to join the dots together.
the pattern looks pretty much like a wave form which gave me an idea so I simply listed the tweets and :

holy cow! that’s a waveform ! (HTML version here! )
I could just inject it into a Sound object and become the master of the universe or at least reveal the essence of Twitter
but it took like 15 minutes to collect all those precious tweets + I ‘ve never tried live sound generation…
Have I?
this led me to that guy who is a perfect mix between Woody Allen and Keith Peters: http://www.adobe.com/devnet/flash/articles/dynamic_sound_generation/
so finally after a couple of modifications here’s my very first sound application (woohoo!):
the playhead is not accurate but… who cares…
so to sum it up:
- Twitter is cool.
- API is your friend
- visualization is a hard job
- live sound generation is cool
everything is cool yet the question remains: “WHAT DO I DO WITH ALL THAT?”
it is a real question ; playing around with data is nice (there are lots) but ‘what for ?’ is a bothering question I still can’t find a decent answer to.
well at least this time the answer was ‘for fun!’ :)
 FlashDevelop
 HAXE
HAXE
my beloved readers wrote…