a Graph is a series of vertices (nodes) connected by edges (“segments”). it can articulate data, perform operations and provide insights on them. data visualization makes massive use of 2d planar graphs (you’ve probably seen many Force Directed Graphs) but a display list, a 2D polygon, a 3D mesh, a roadmap are also graphs of some sort.
in its simplest form this would be a Graph:
|
1 2 3 4 5 6 7 8 9 10 11 12 13 14 15 16 17 18 19 20 21 |
var Vertex = function( data ){ /*store the data*/ } var Edge = function( v0, v1 ){ this.v0 = v0; this.v1 = v1; } var Graph = function( vertices, edges ){ this.vertices = vertices; this.edges = edges; } //create two vertices var A = new Vertex( data ); var B = new Vertex( data ); //create an edge to bind the two vertices var E = new Edge( A, B ); //create a graph var graph = new Graph( [ A, B ], [ E ] ); |
the graph contains 2 vertices A & B connected with an edge E.
now if vertices are letters, it can represent a word, if vertices are numbers, the graph can be a mathematical operation, if vertices are 2D or 3D points, the graph is a line in 2 or 3 dimensions, etc. depending on the nature of the vertices, the edge can also represent different things, from a concatenation if vertices are letters, an operation if vertices are numbers or just maintain two references to the vertices pointers. an edge can be undirected meaning that the connection from E( A,B ) == E( B, A ) or directed which means that E( A,B ) != E( B,A ). if you think of our graph as a roadmap, the edge we created earlier would be a one way street between A and B. this is important, especially in geometry ; for instance it allows to test the winding of triangle and eventually unify or flip it. if we need to go back to A from B in a directed graph, we have to add a new Edge like so :
|
1 |
graph.edges.push( new Edge( B,A ) ); |
then we can go back from B to A.
a directed graphs can be cyclic which means that there are “loops”, if you take a triangle with 3 vertices A, B, C and 3 edges between them, it’s possible to go from A to B, then from B to C and from C to A, that’s a cycle. it makes some operations a bit tricky as we must be careful not to fall into a cycle while traversing the graph.
otherwise, both the vertices and the edges can be updated separately making it a very flexible data structure, a graph is N dimensional, N being the dimension of its vertices (the edges always have a cardinality of 2). the edges often have a value usually called a weight which can represent anything that happens between the 2 vertices it binds.
trees are a special case of graphs ; trees are directed connected acyclic graphs ; directed means that E( A,B ) != E( B,A ), everything originates from a single vertex (the root) and every vertex is connected to a parent or the root node (connected), an edge must not create a loop or cycle (acyclic).
I’ll leave the theory here, it was just to give an overview, there are gazillions of books and articles about graphs and graph theory.
as I care mostly about graphics, let’s start with 2d graphs, usually they represent hierarchies, networks or relationships between nodes. below I create a bunch of random points, perform a Delaunay triangulation (the grey mesh) then I use the triangles’ centers to build a second set of vertices. then I compute the Minimum Spanning Tree (MST: a tree that covers all the nodes of the graph) and paint it in blue (click to reset).
the MST is a thing of beauty, it’s the set of edges with the minimal weight (I believe there can be more than one MST), it links all the vertices of the graph ; if the graph is connected, you can reach any vertex from any vertex by traversing the tree. the header picture of this article is a MST computed on a 45K vertices mesh, it seems disconnected because I didn’t render the back faces.
most of the time in maps edges store their length and vertices store some extra information. below is the map of the parisian metro, the vertices are the stations, each line is an edge set and the network as a whole is described by another edge set.
drag the cursor over a station to see its name, tap to select a starting point and a goal.
the multicolored band at the bottom represents the different lines to use from the start to the goal. the important thing here is that different edge sets can use the same pool of vertices ; finding the shortest path between 2 nodes uses the global graph while the colors are retrieved from each lines’ graphs. the global graph ignores the colors of the lines, the lines ignore the interconnections.
if this shortest path returns the shortest distance from a station to another, you can tell by the colors alone that it’s probably not the shortest in time. that’s because the metric used to compute the edge’s weight is the distance and there’s no time penalty for changing line. the algorithm could easily be modified to include those rules.
as a graph is basically a series of segments, it’s easy to interpolate a value along the edges ; in the example above, a dot is going to back and forth along the shortest path. to compute its position, I use this method:
|
1 2 3 4 5 6 7 8 9 10 11 12 |
function getPositionAt( points, t ) { var length = points.length-1; var i0 = Math.floor( length * t ); i0 = i0 < length - 1 ? i0 : length - 1; var i1 = Math.min( i0 + 1, length ); var delta = 1 / length; var nt = ( t - ( i0 * delta ) ) / delta; return {x:lerp( nt, points[i0].x, points[i1].x ), y:lerp( nt, points[i0].y, points[i1].y ) }; } |
where points is a series of ordered vertices and t is a normalized ratio [0,1] first we find the 2 bounds i0 and i1 that are the points of the path between which t will fall then it computes a new t value nt that represents the local value of t between points[i0] and points[i1] the last step is to linearly interpolate nt between points[i0] and points[i1].
which means that we can create agents \o/ agents can move along the edges and bring life to a graph, in the above example, agents would probably represent trains.
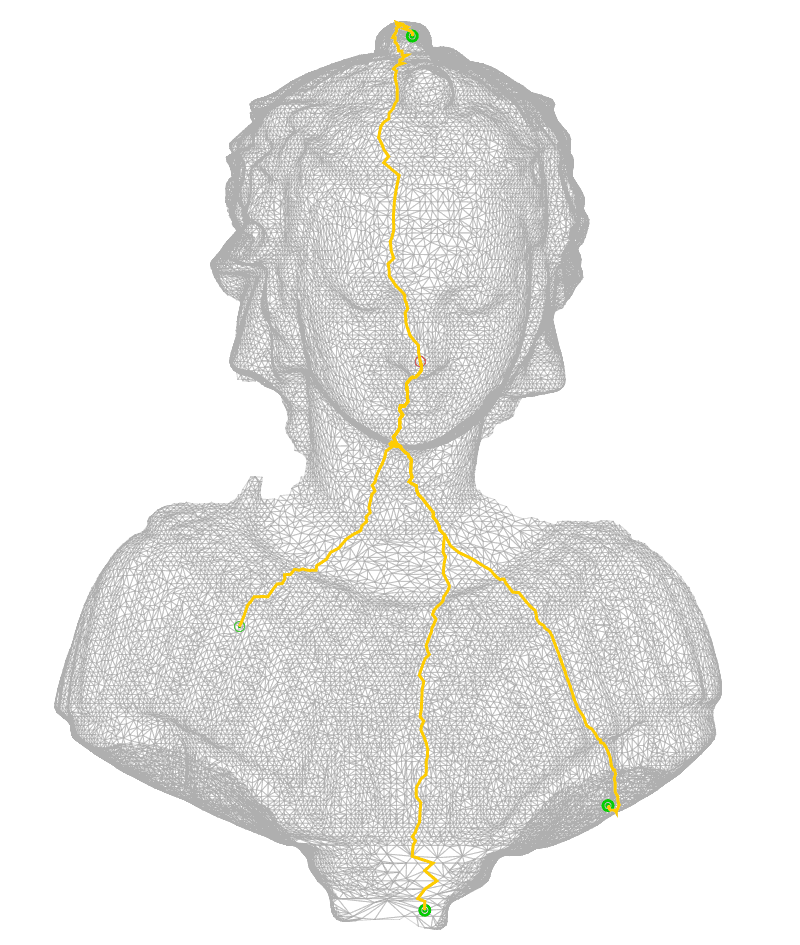
graphs work in any dimensions, below is a glorious flying crab gracefully rotating in space, I compute its MST and let you select 2 nodes to see the shortest path between them.
note that the Dijkstra algorithm is not the fastest, this is a screenshot of a 45k mesh vertices, the dijkstra algorithm took more than a 90 seconds to compute the shortest path to all the vertices from the nose. on the other hand, retrieving a path from any point of the graph is extremely fast as it’s a only a linked list traversal.
in a word, graphs are your friends, they are useful for games, modeling and simulations.
here’s the code for the demos.
my first implementation of the Dijkstra algorithm was completely flawed :/ I stored the maximum distance for each vertex instead of using the edge’s length. the results were not completely incoherent and that’s why I didn’t spot it at first. after Makc’s comment I tried to improve the computation time and rewrote a second version that was not only twice faster but also gave differents (better) results & more consistently.
so to settle the score, I checked both the original (flawed) and the new versions of my Dijkstra against an A* pathfinder. as expected the A* is insanely faster (~10 ms on my machine) yet much less accurate. below is a demo showing 5000 vertices and roughly 30.000 edges where I perform the searches:
in blue the new Dijkstra, in red, the old one, in orange, the A* pathfinder. on double tap/click, the root is re-initialized and both Dijkstra are being performed. when you click / drag around, the shortest paths are being computed using the 3 algorithms.
it is obvious that a game where a character moves frequently and re-evaluates both it’s location and its target will benefit from the A* approach on the other hand if you have to reach a fixed target (like with a GPS) it might be much better to compute a Dijkstra once and for all then, whatever the way you’ll take or the obstacles you’ll encounter, the algorithm will be able to give you an alternative route to your goal almost instantly.
another thing I didn’t mention is that a graph can be created from it’s edges and an edge length. this is enough to build a representation of the graph, below is an example of the LCF notation which describes the edge structure in a very compact form:
you can choose from the dropdown list, can watch the corresponding graph. you can read about the LCF on wolfram the implementation is pretty straight forward, you need to split the code into an array of instructions and a cycle count, the code below does this:
|
1 2 3 4 5 6 7 8 9 10 11 12 |
//gets the operations var operations = code.match(/(\[.*\])/); var cycle = operations[1].substr( 1, operations[1].length - 1).split( ',').map( function(v){ return parseInt( v );}); //gets the vertices count var count; var c = code.match( /]([0-9]+)/ ); if( c == null ){ count = cycle.length; }else { count = parseInt( c[1] ) * cycle.length; } |
then you need to build count vertices and bind them together:
|
1 2 3 4 5 6 7 8 9 10 11 12 13 |
//builds the vertices var vertices = []; for( var i = 0; i < count; i++ ){ var v = new Vertex( { x:Math.random() - .5,y:Math.random() - .5,z:Math.random() - .5 }); vertices.push( v ); } //build the inital chain var edges = []; for( i = 0; i < count; i++ ){ var e = new Edge( vertices[i], vertices[(i+1)%vertices.length] ); edges.push( e ); } |
note that the vertices are distributed at random, the connections between 2 vertices will make the shape emerge. finally we create new edges according to the chosen rule which gives:
|
1 2 3 4 5 6 7 8 9 10 11 12 |
//applies the rule var ruleId = 0; for( i = 0; i < count; i++ ){ //determine the id of the vertex to bind to the current vertex var id = ( i + cycle[ ruleId % cycle.length ] ) % vertices.length; if( id < 0 )id += vertices.length; //create the new edge edges.push( new Edge( vertices[i], vertices[id] ) ); ruleId++; } |
then during the update, I use a cheap attraction repulsion routine (where restLength is the target length for the edges):
|
1 2 3 4 5 6 7 8 9 10 11 12 13 14 15 16 17 18 19 20 21 22 23 24 25 26 27 28 29 30 31 32 33 34 35 36 37 38 39 40 41 |
graph.vertices.forEach(function( a ) { //attraction a.neighbours.forEach(function( b ) { var dx = b.x - a.x; var dy = b.y - a.y; var dz = b.z - a.z; var d = Math.sqrt(dx * dx + dy * dy + dz * dz); var diff = ( restLength / a.neighbours.length ) - d; var offx = (diff * dx / d) * .5; var offy = (diff * dy / d) * .5; var offz = (diff * dz / d) * .5; a.x -= offx; a.y -= offy; a.z -= offz; b.x += offx; b.y += offy; b.z += offz; }); //repulsion graph.vertices.forEach(function( b ) { if( a == b ) return; var dx = b.x - a.x; var dy = b.y - a.y; var dz = b.z - a.z; var d = Math.sqrt(dx * dx + dy * dy + dz * dz); var diff = restLength - d; var offx = (diff * dx / d) * .01; var offy = (diff * dy / d) * .01; var offz = (diff * dz / d) * .01; a.x -= offx; a.y -= offy; a.z -= offz; b.x += offx; b.y += offy; b.z += offz; }); }); |
the length of the edge depends on the number of connections the vertex has, each vertex tends to repel the others at restLength and that’s about it. indeed some vector would be more elegant in this situation but it works well enough for a little demo. I like very much the minimal complexity of such graphs, some of them are mind bending even with a very low amount of vertices/edges, they would sure make interesting puzzles :)
> 90 seconds
that’s a bit heavy, I have the code in one project that does this in about 1 second or less; initially bugged cytoscape author, but finally used js build of good old haxe polygonal lib. probably I need to upload the result somewhere.
after your comment I had a second look to see if something could be done about the speed, I discovered that my implementation was broken so I fixed it :)
the problem with perfs is that it would mean having a specific data structure (for the vertices, the edges, queues &| the sets) I didn’t want to be too specific to that extent. in the improved version, I used flat arrays to store the costs/dists and 2d 2D arrays of Floats and Ints to store the adjacency and the edges distances. the real bottleneck is there ; build these lists takes as much CPU time as computing the shortests paths… I don’t think there’s a solution that would work without specific (and fast) data structures.